
I am taking a very interesting computer graphics course class and finally learned about curves.
Why do I care about curves? My background is in Computer Aided Design (CAD) and machining, so I have always been interested in the .STL file format which .
I never knew what interpolation meant until I took this class.
From my understanding, interpolation is used when we have a set of data points and we need to estimate values between these points. This could be necessary for various reasons, such as creating a smooth curve from discrete data points.
For this assignment, I had to implement a Bezier and B-spline curve, which are forms of interpolation.
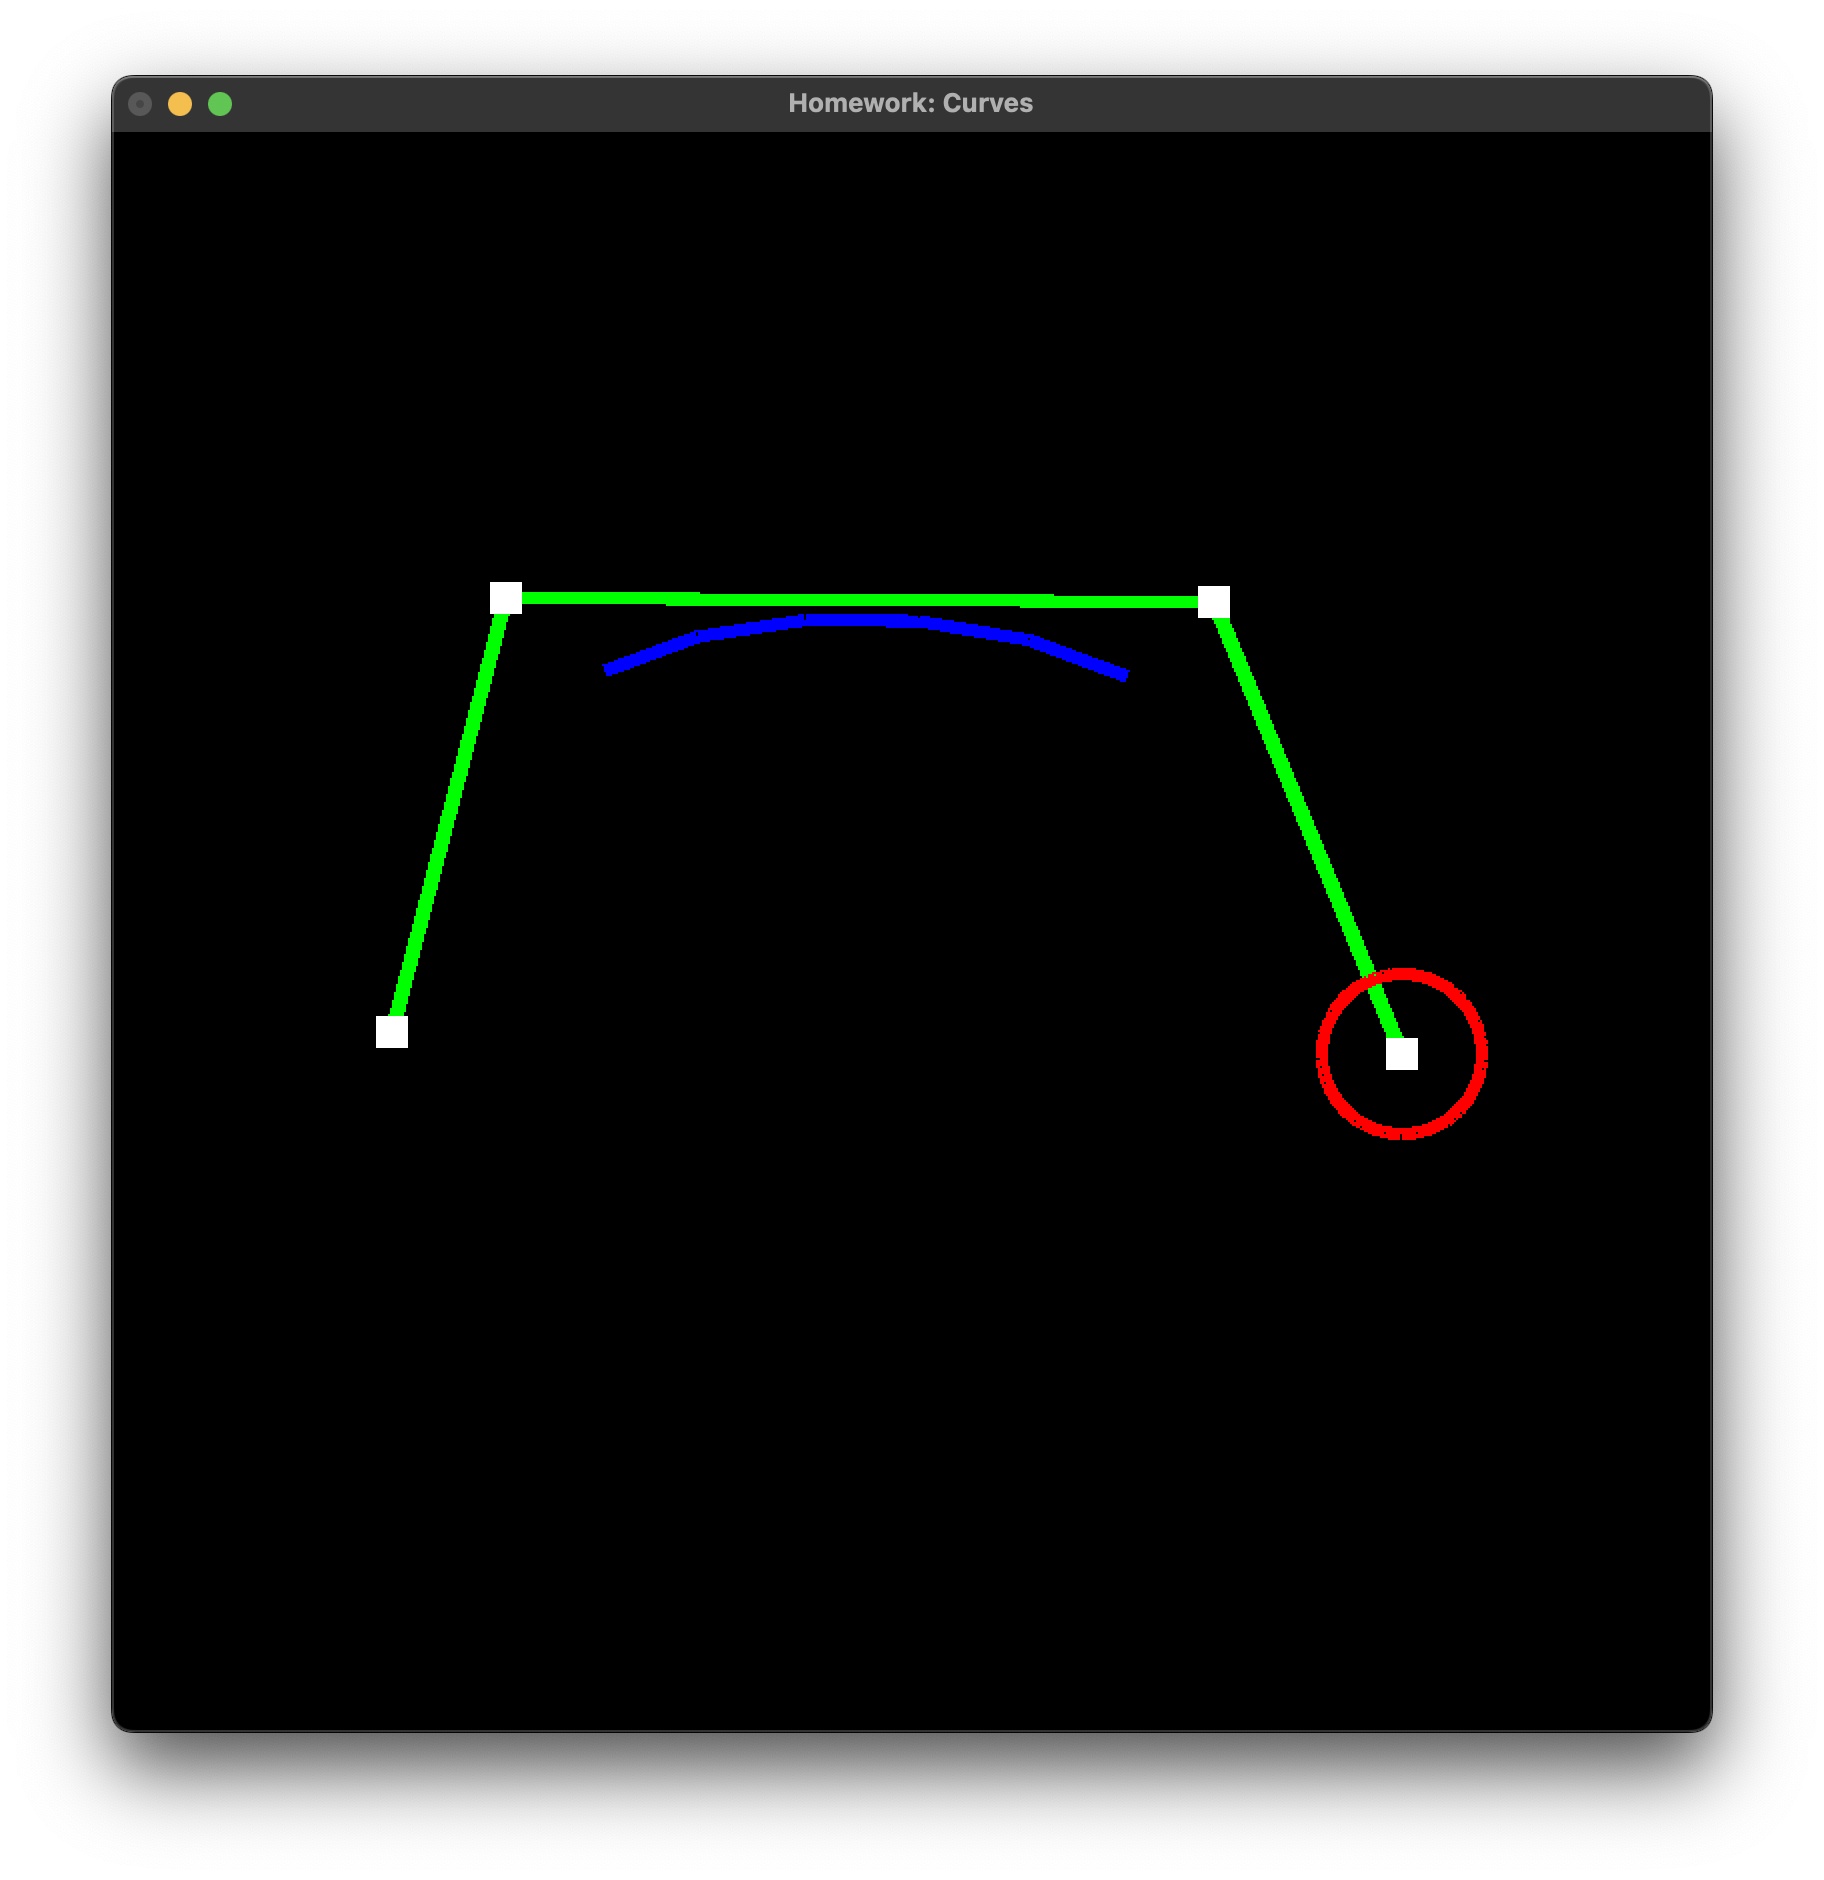
Bezier Curve Implementation:
The Bezier curve is drawn using recursive subdivision. The draw function is called with a specified levelOfDetail, which determines how many times the curve will be subdivided.
If it’s the top-level call, i.e., levelOfDetail is greater than 0, the control points are connected using the connectTheDots function.
If levelOfDetail is 1 or less, the curve is drawn by connecting consecutive control points with straight lines.
If levelOfDetail is greater than 1, the control points are recursively subdivided into left and right halves. Then, the draw function is called recursively on each half with a reduced levelOfDetail.
This recursive subdivision continues until the base case is reached, where the curve is drawn by connecting consecutive control points with straight lines.
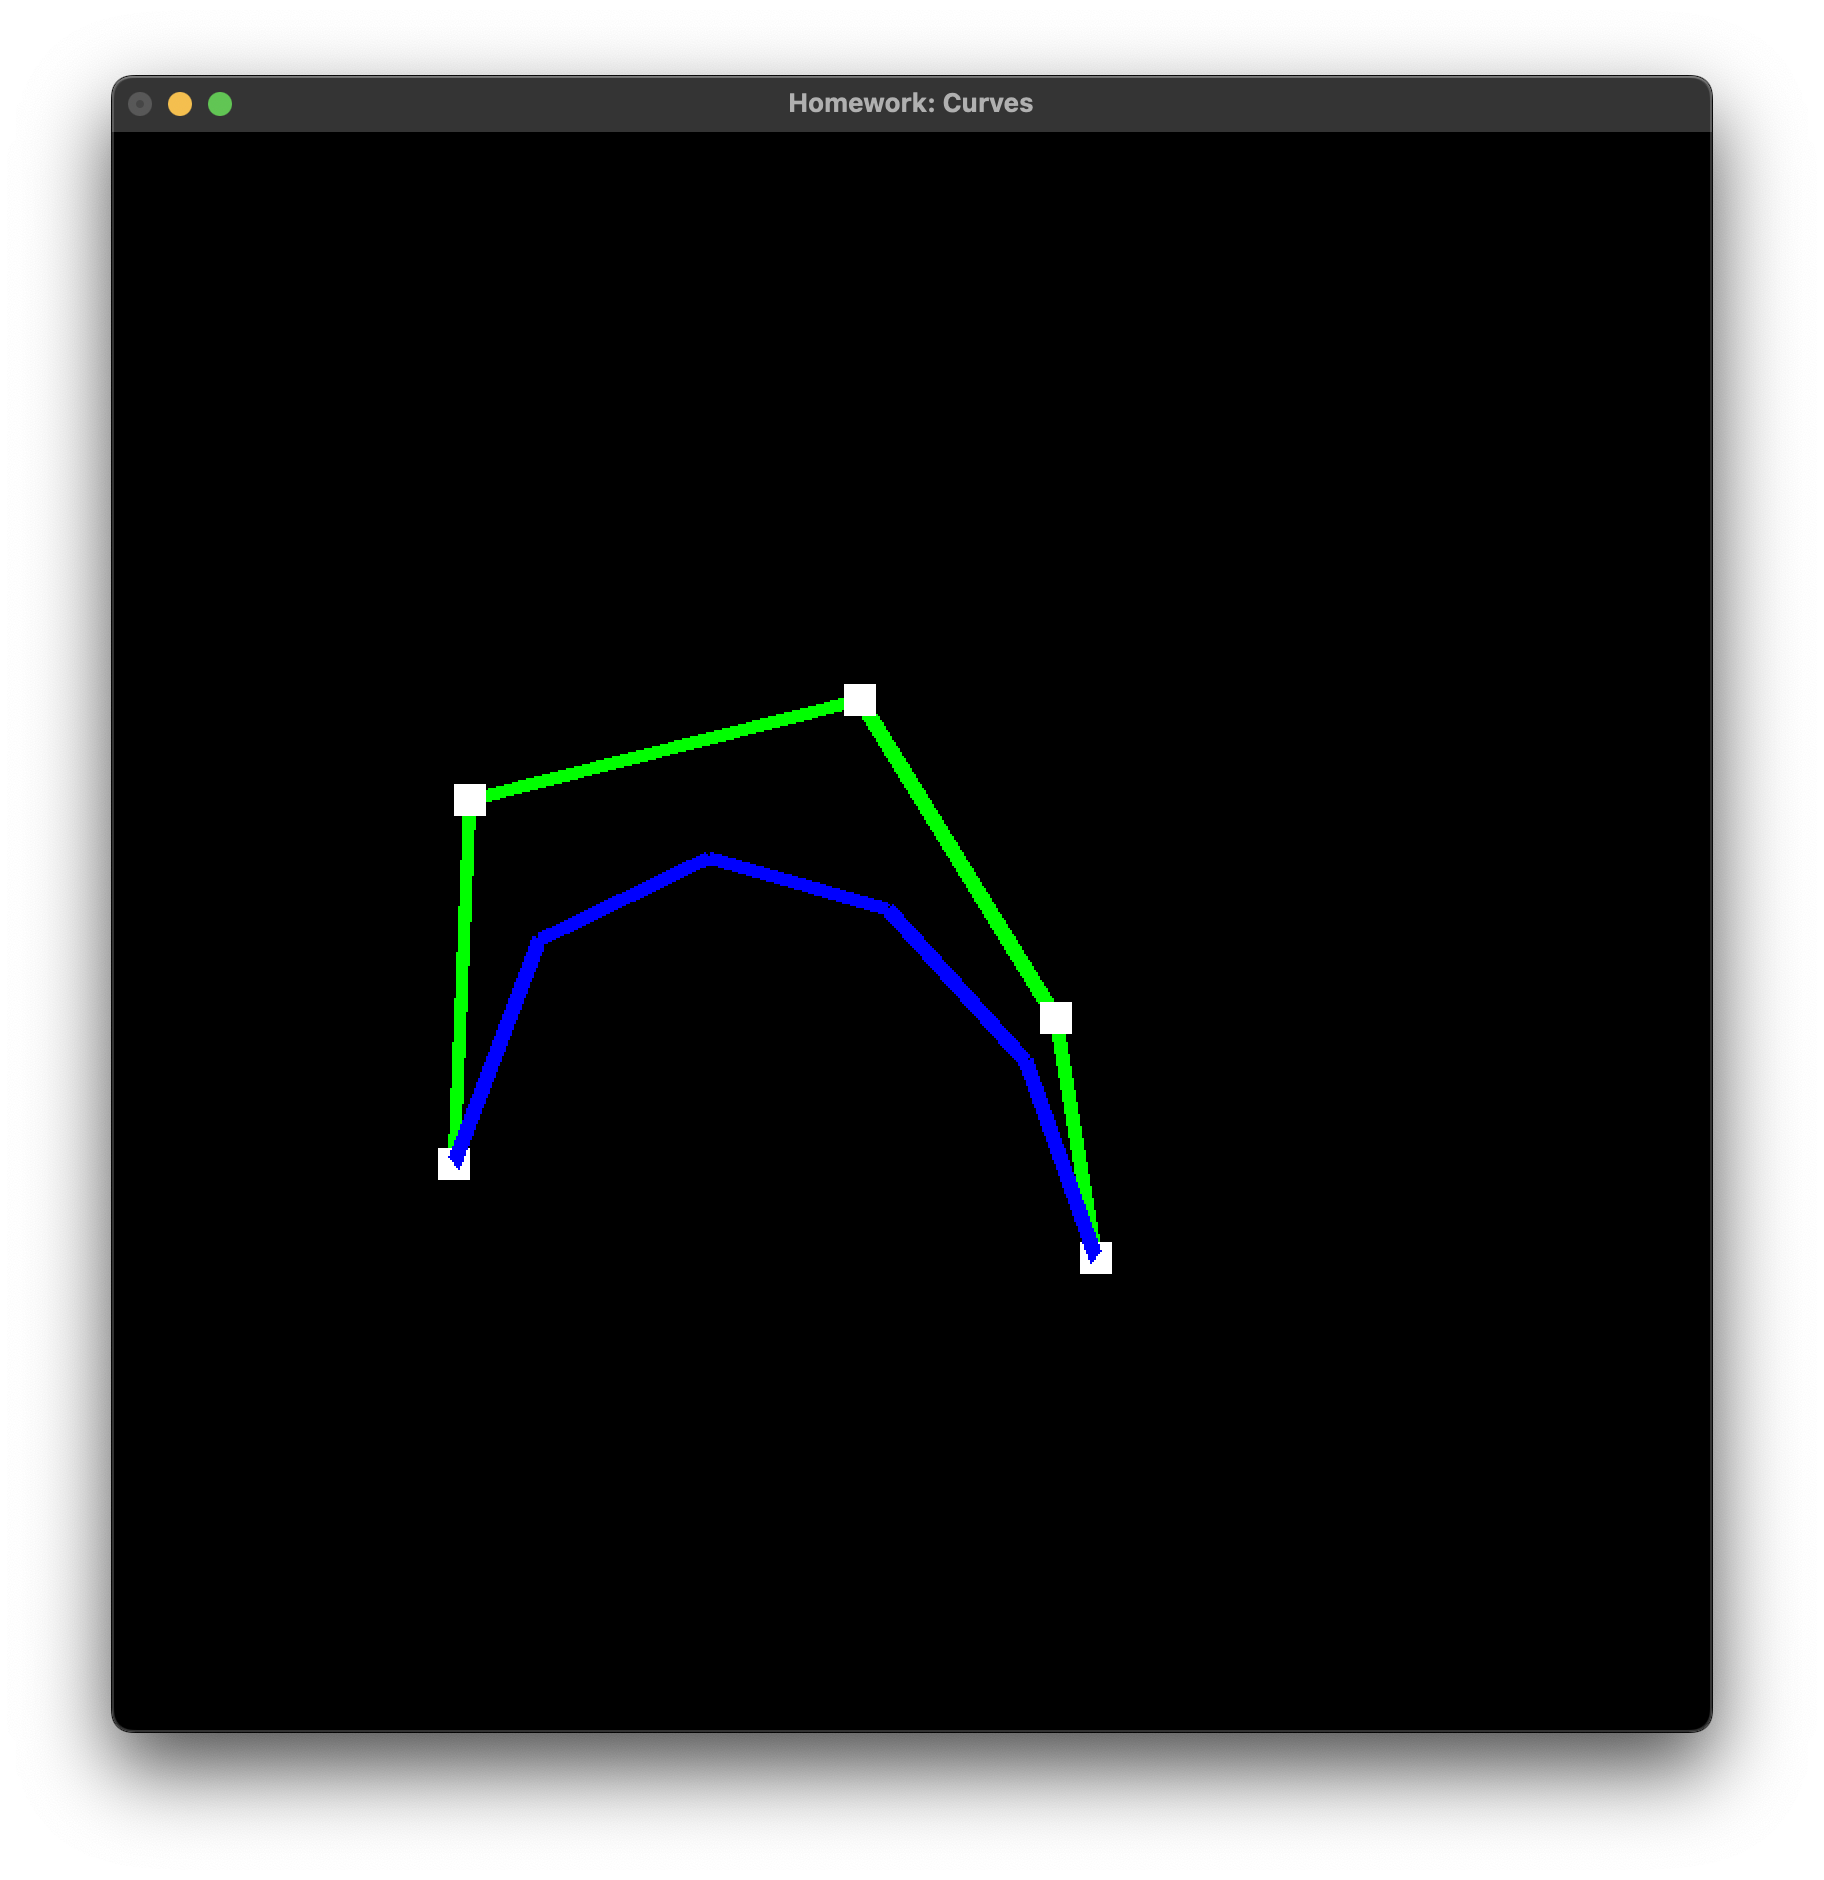
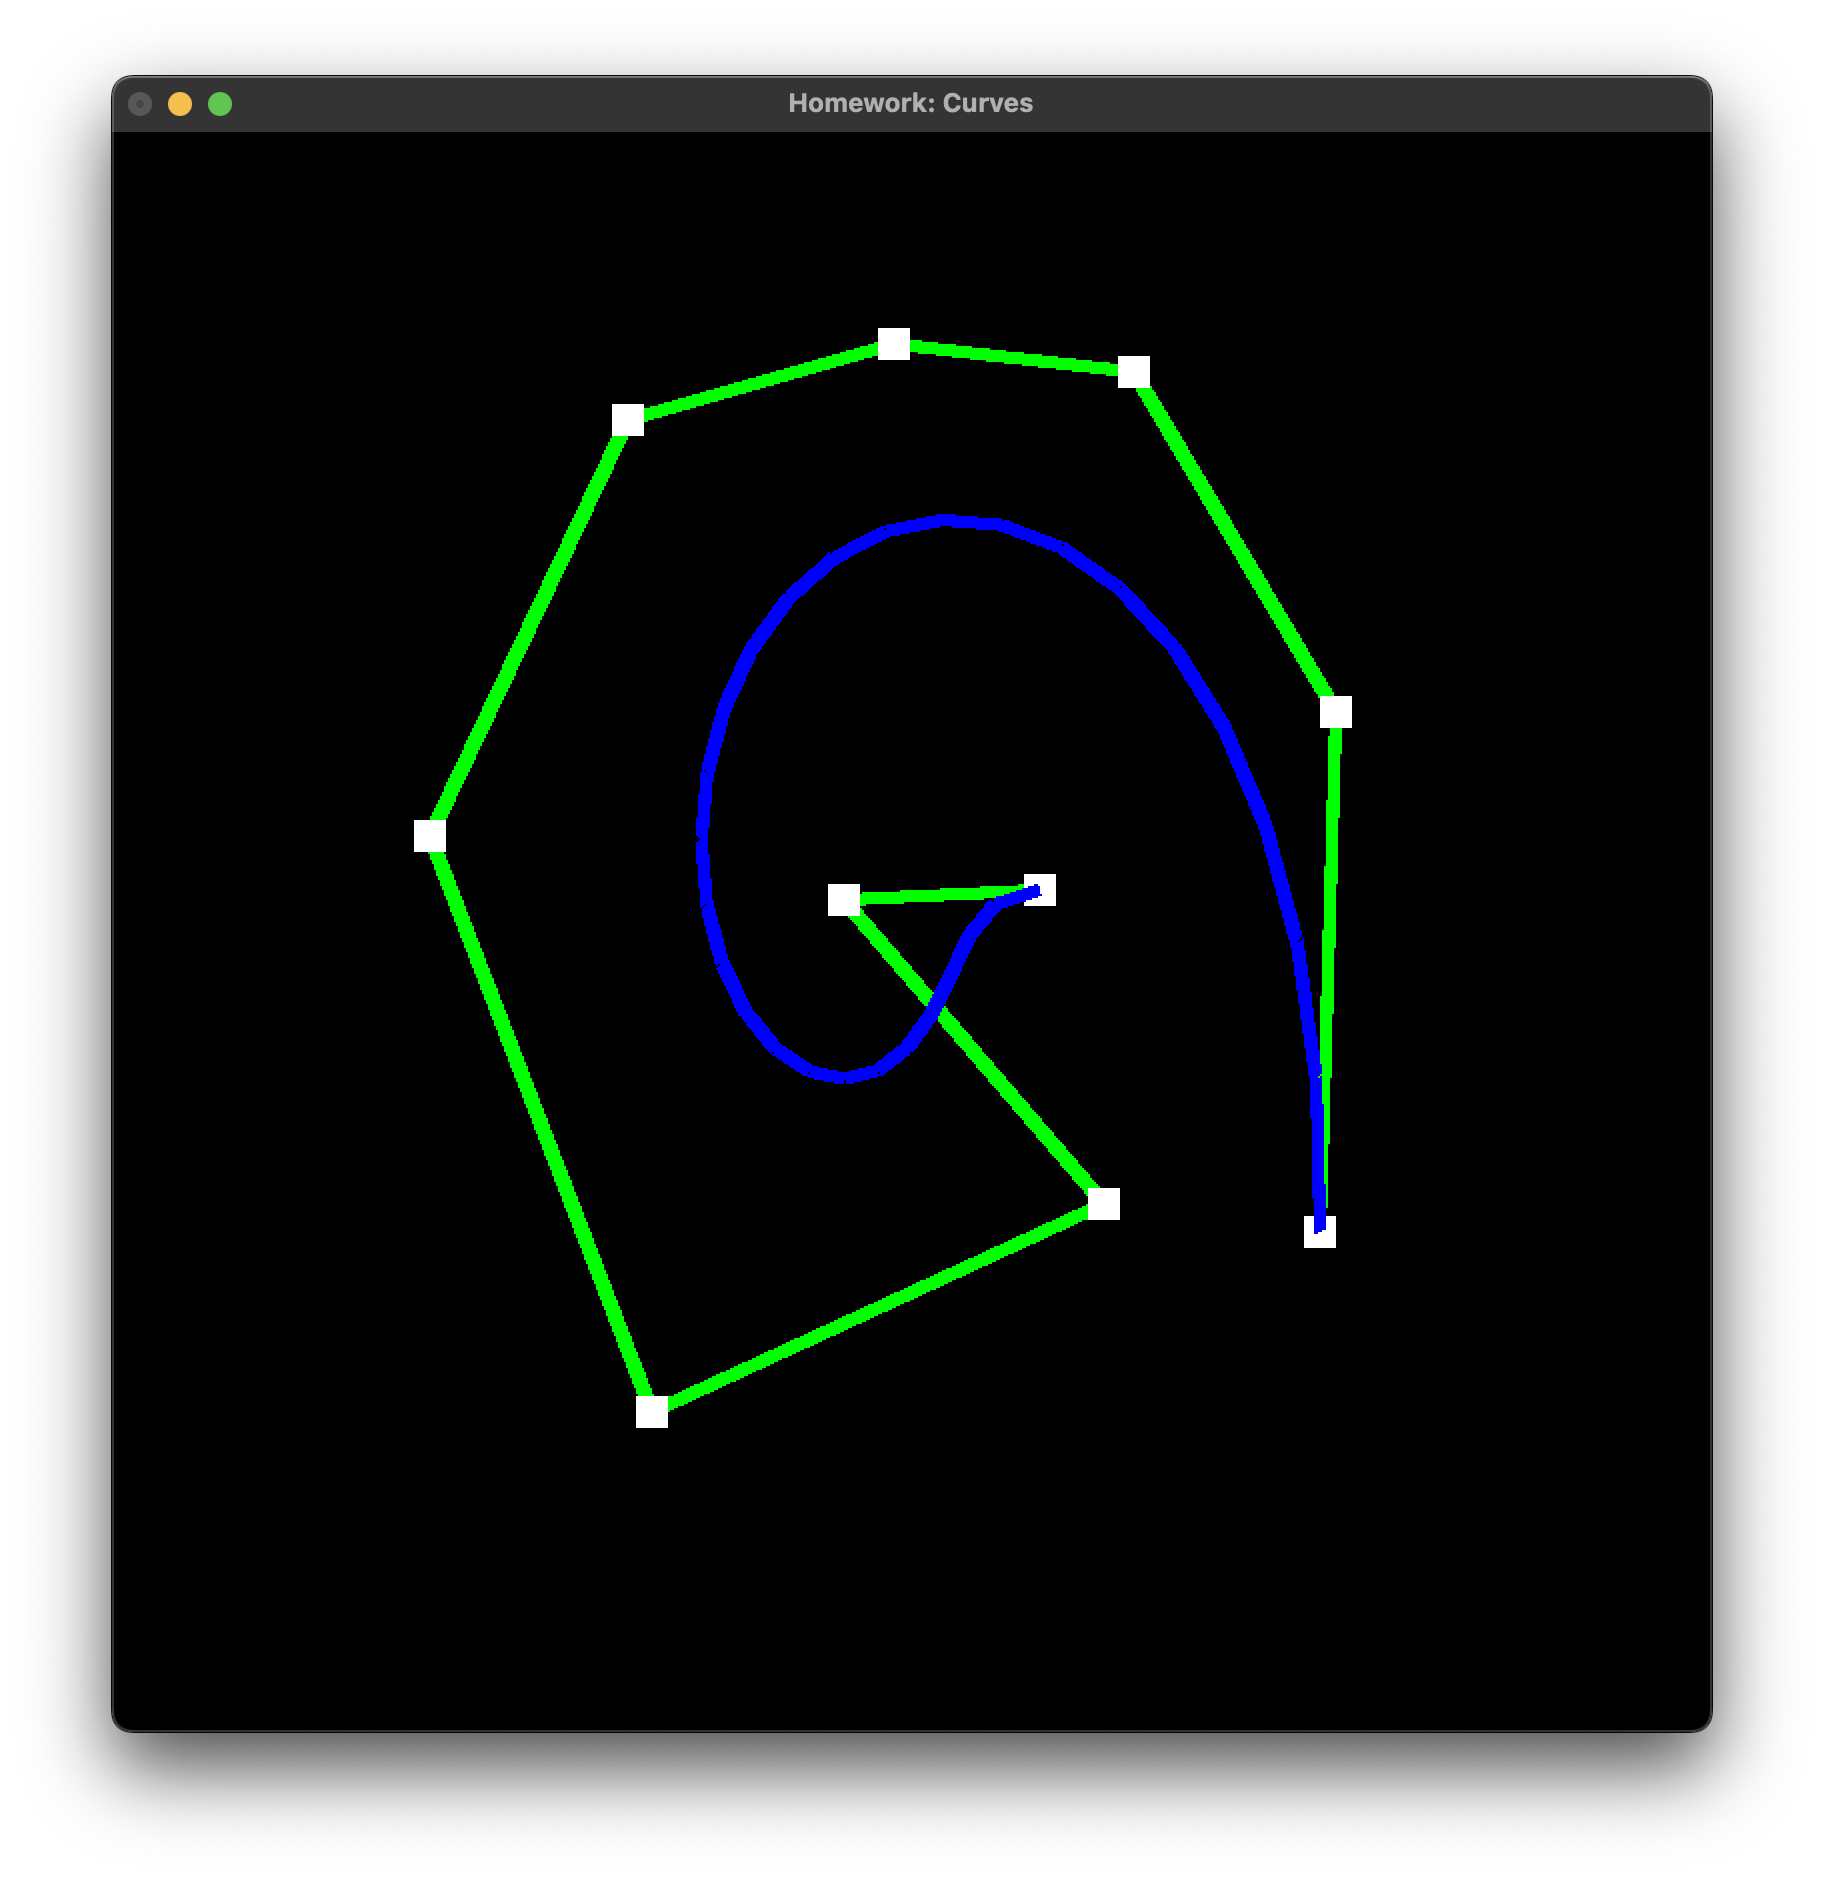
B-Spline Implementation:
The B-spline curve is drawn using a recursive approach. The draw function is called with a specified levelOfDetail, which determines how many times the curve will be subdivided.
The draw function first connects the control points using the connectTheDots function.
Then, it iterates through the control points and draws segments between every set of four consecutive points. This is done using the drawSegment function.
The drawSegment function calculates the points on the curve segment using the B-spline basis matrix and draws lines between consecutive points.
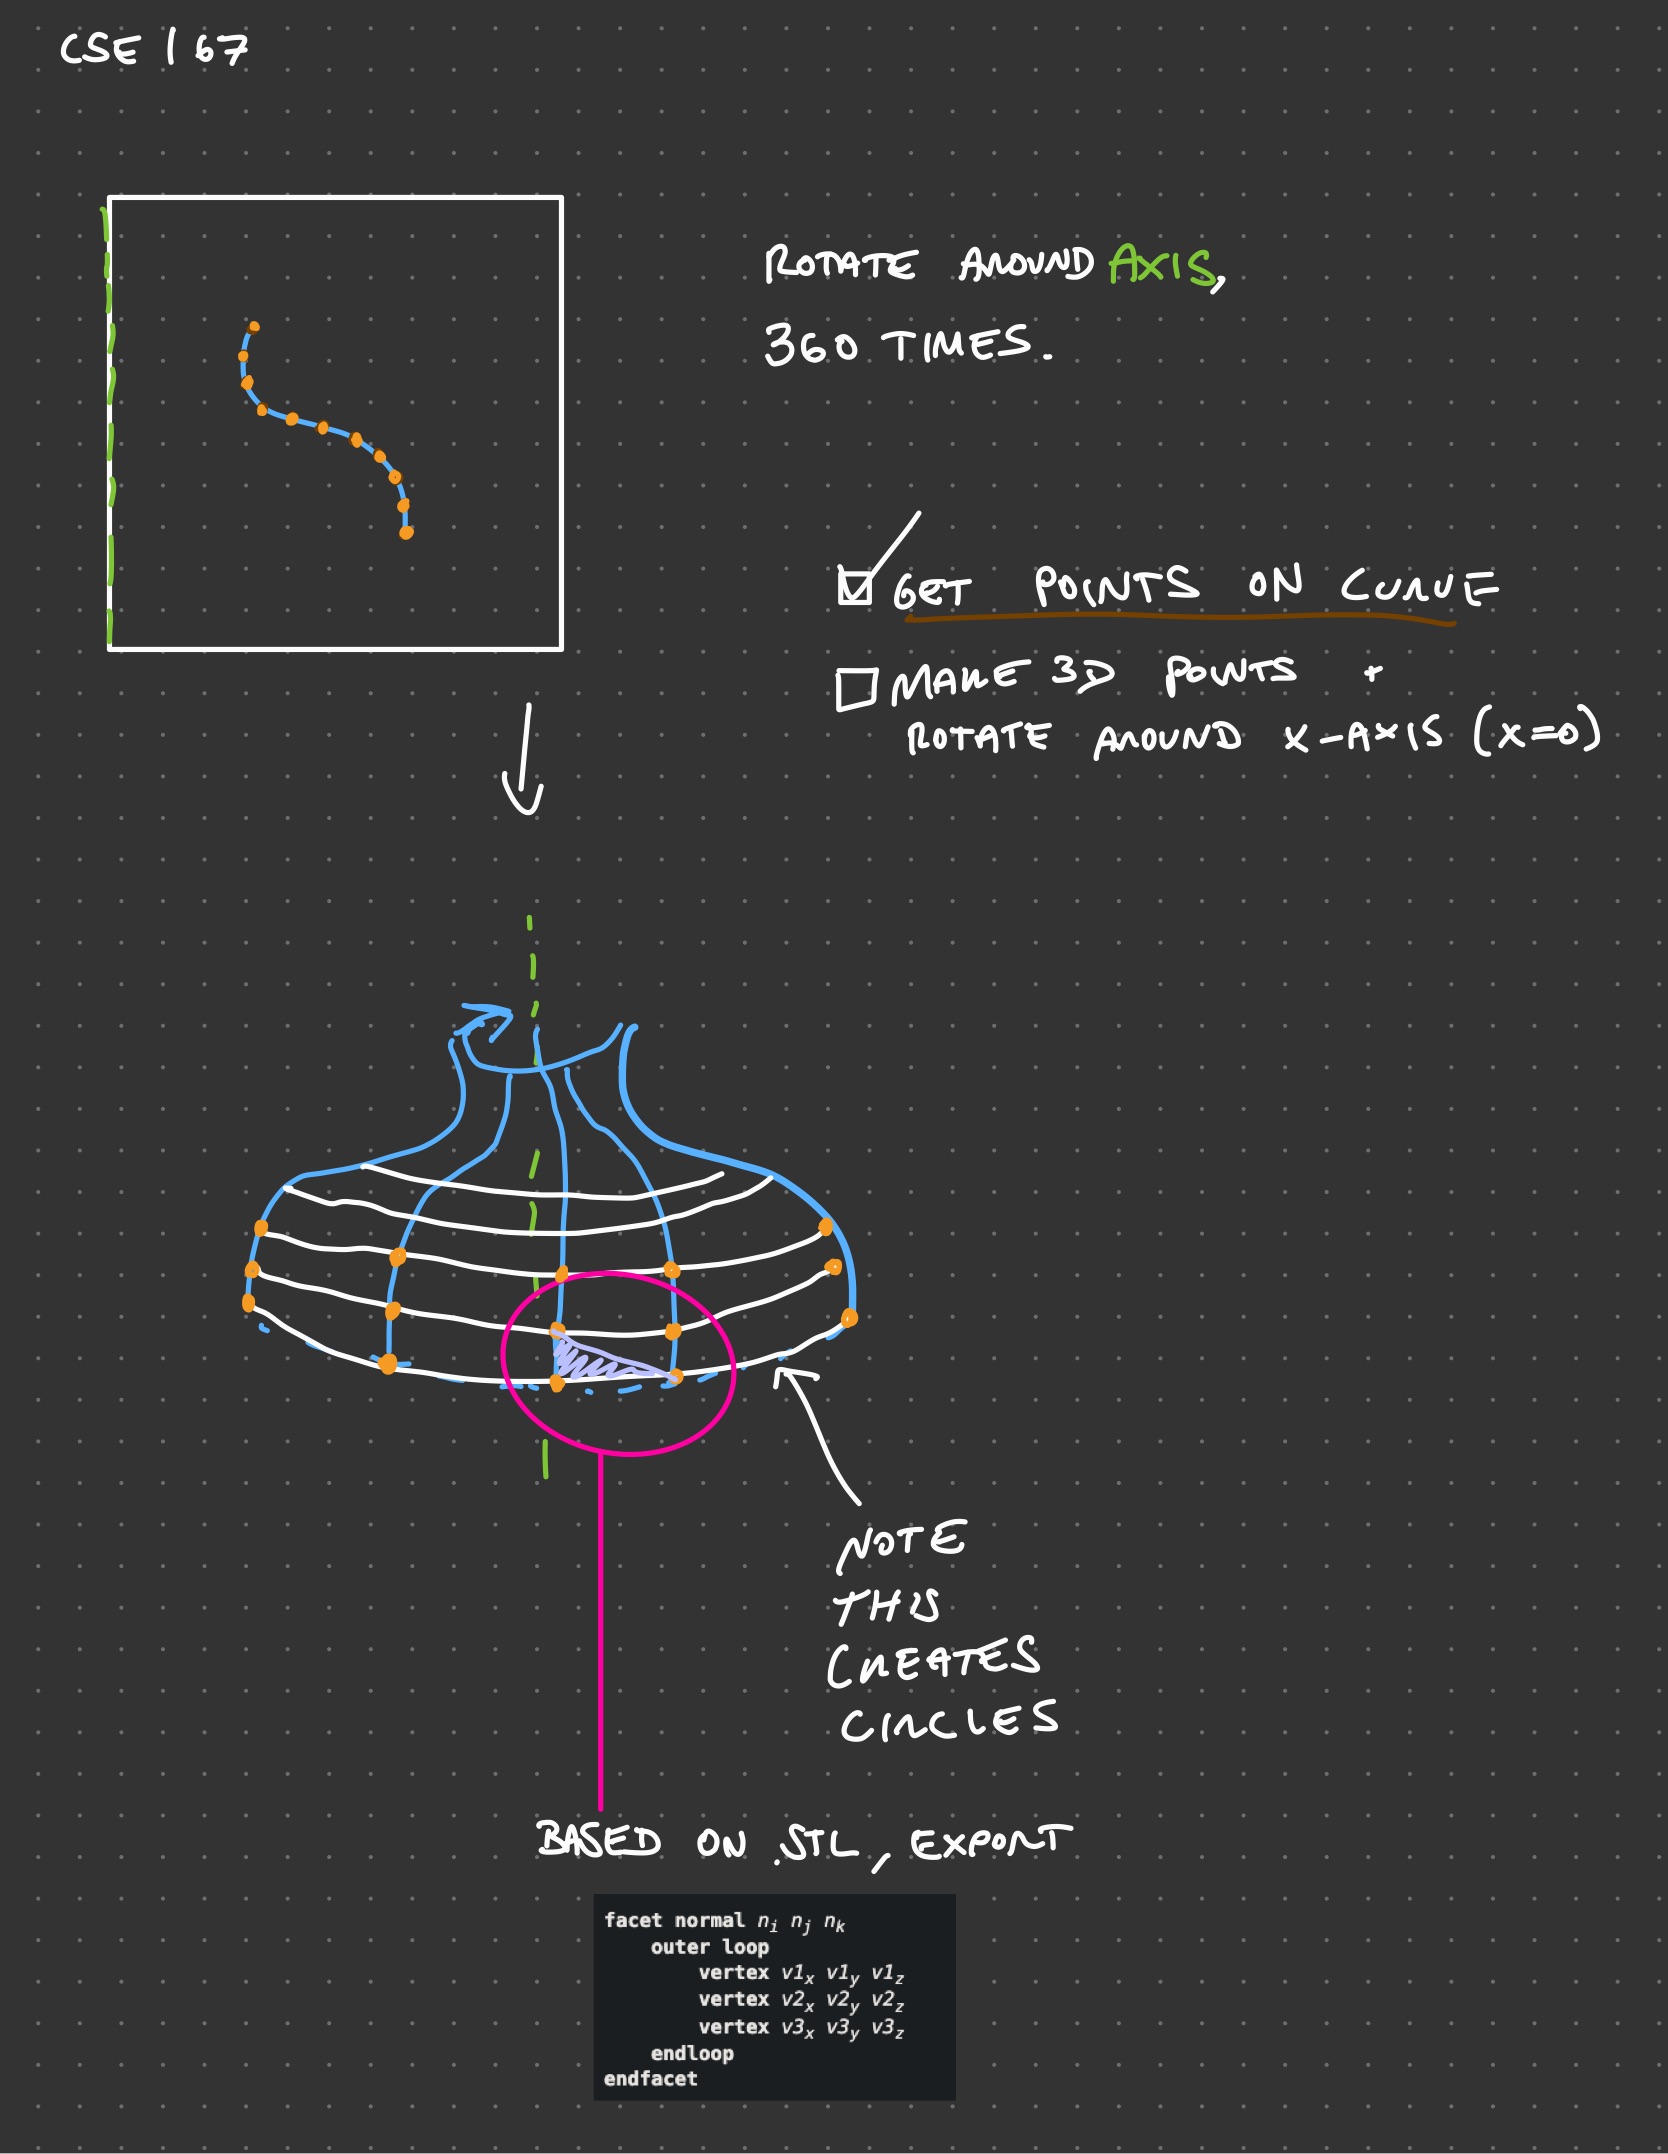
For extra credit, my goal was to do a .STL generation from the curves. My plan is as follows:
- Get points on the curve
- Rotate the curve around the x-axis
- Create a mesh from the rotated curves
- Write the mesh to a
.STLfile
Simple right? I thought so too.
It just wouldn’t work. I kept running into issues trying to make a Point3D object… I probably spent 15+ hours trying to resolve errors. Everytime I restarted, I would get a new error.
I pulled a titanic on the assignment and didn’t finish the extra credit in time… I tried for another 5 hours. I got some progress when working directly in the Curve.cpp, but still couldn’t get the funky.
Then I I realized higher-level programming languages exist for a reason. Also, C++ is apparently bad?
I had no choice other than to implement the whole extra credit assignmet in Python. It took me 1.5 hours and I amazingly got it first try.
Here is the progression of it working!
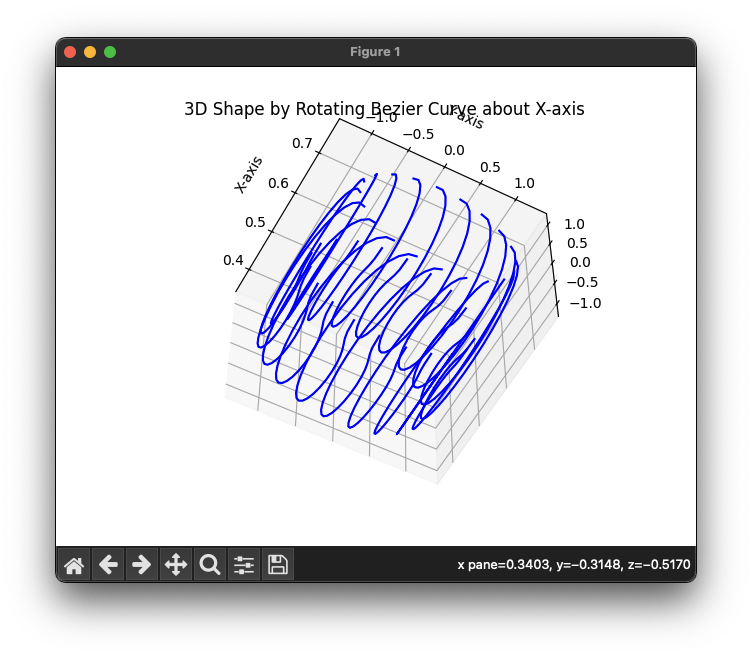
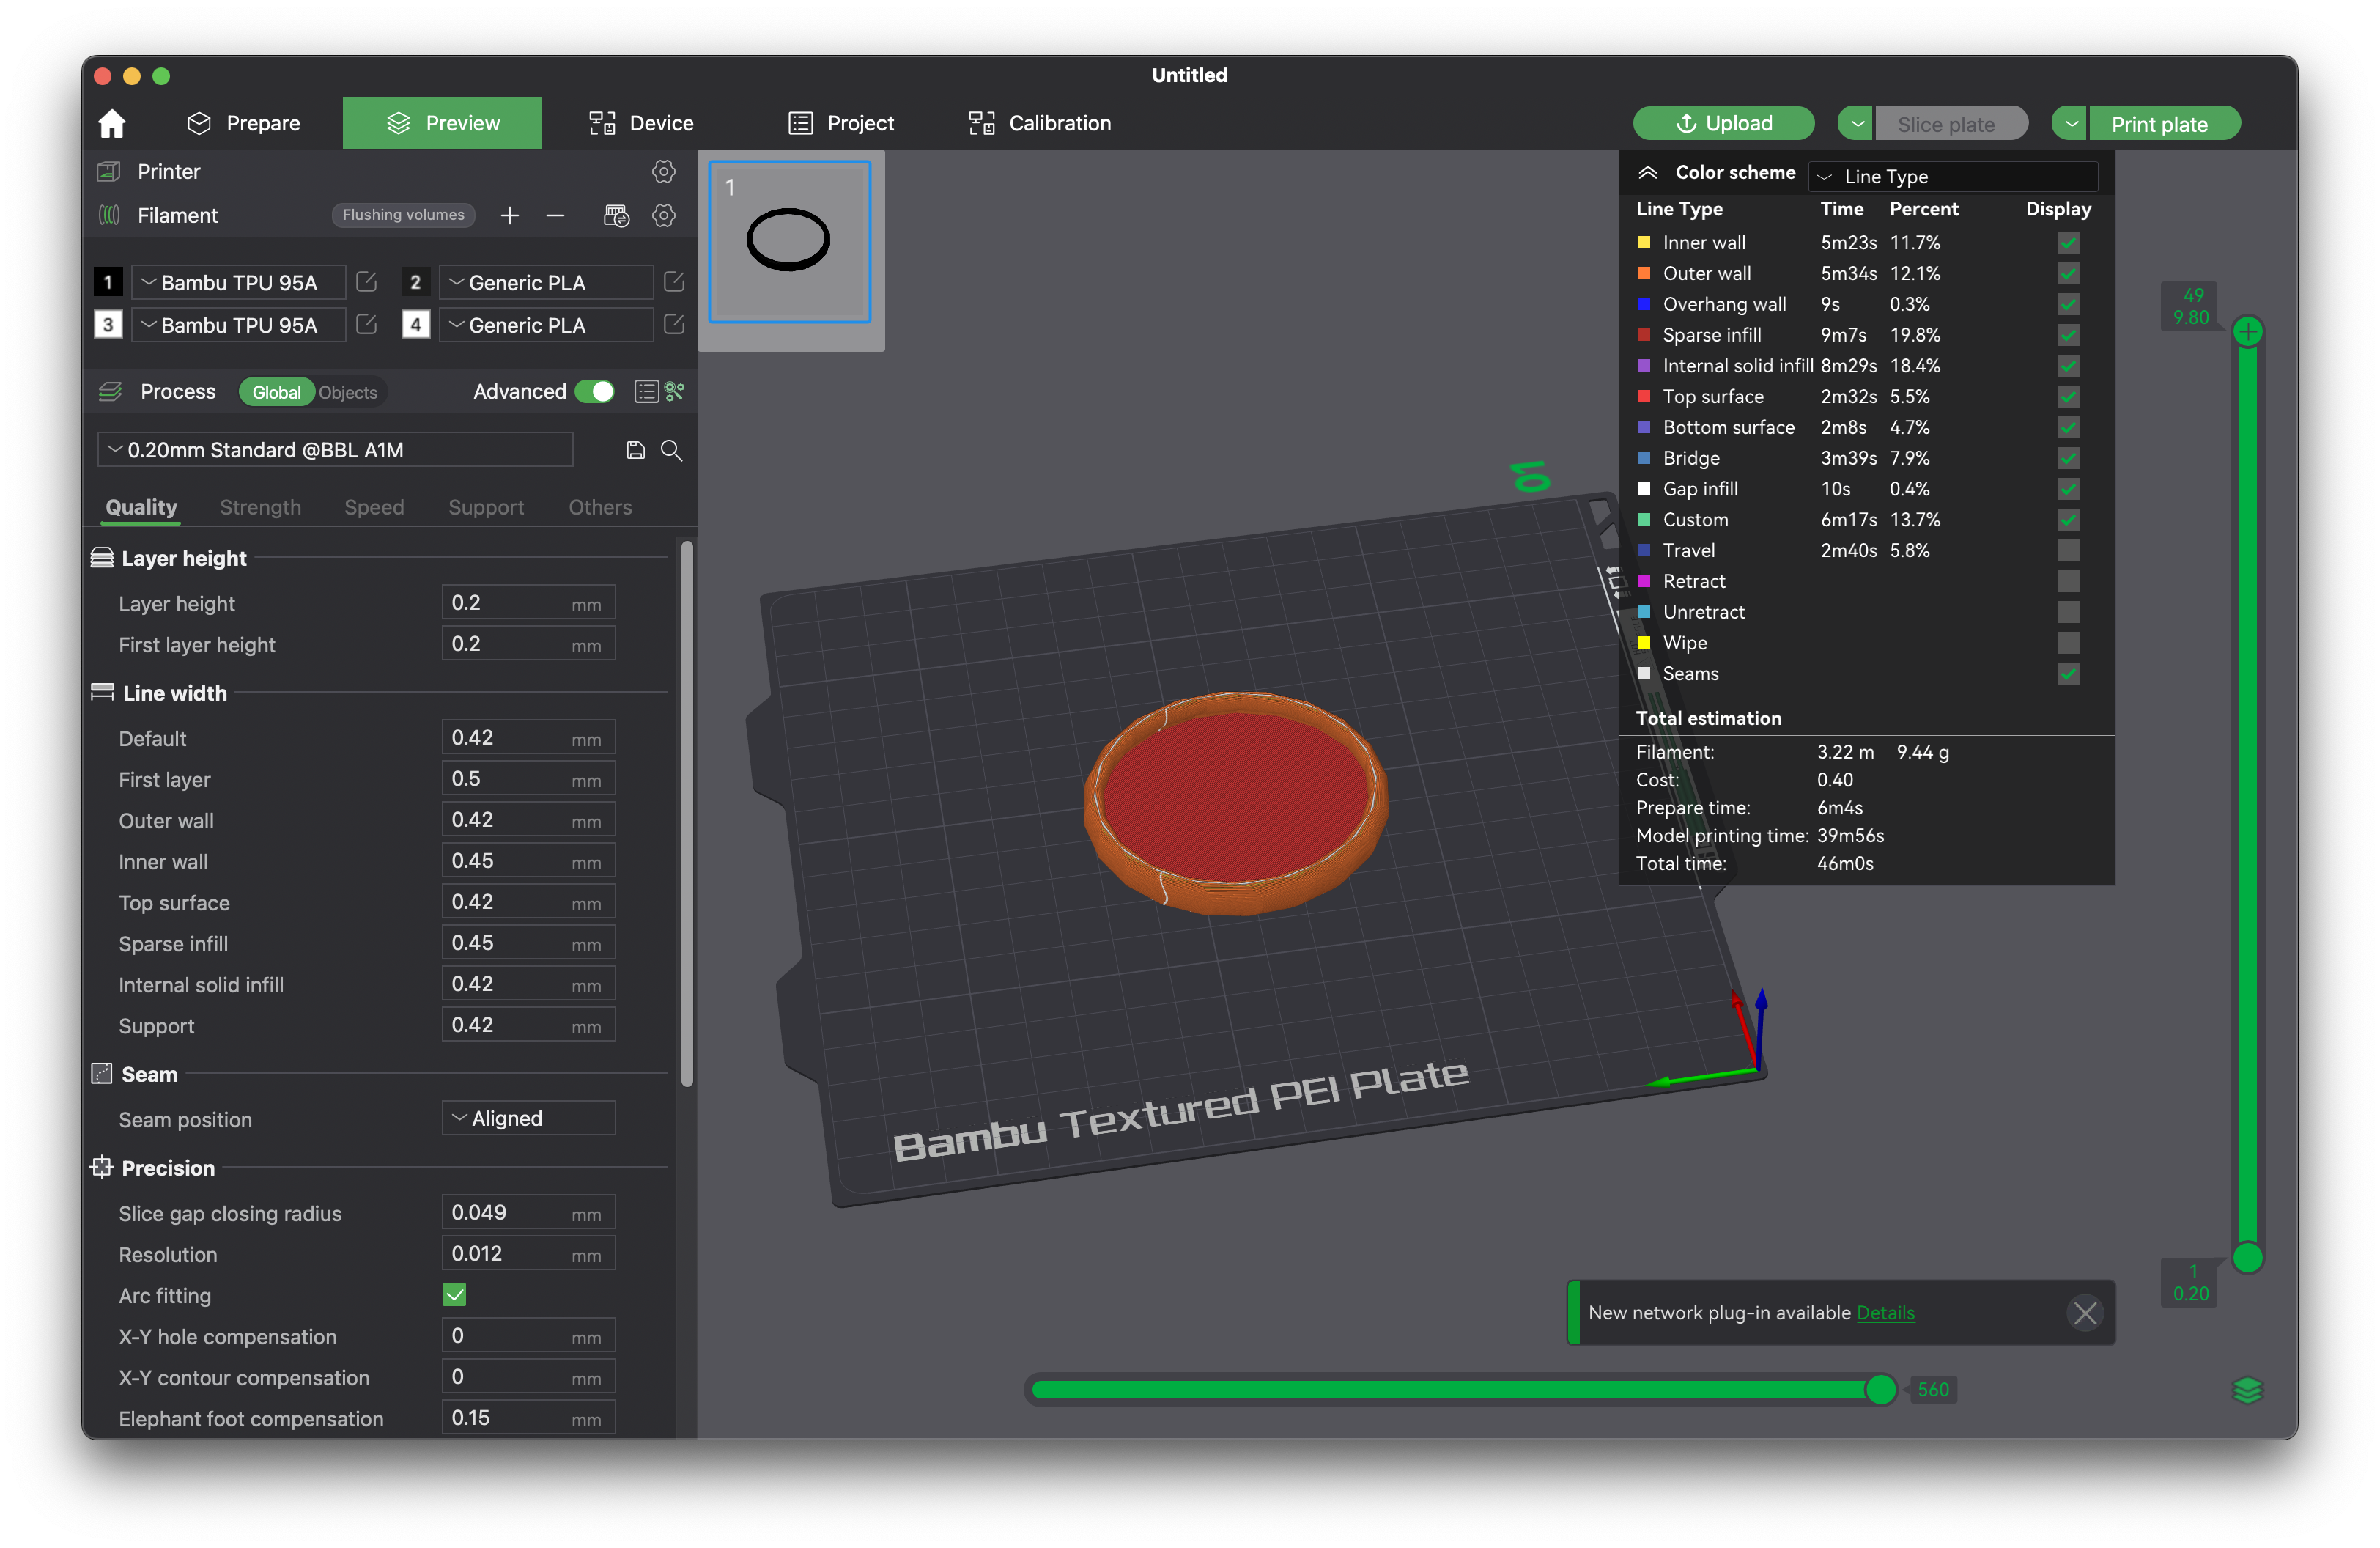
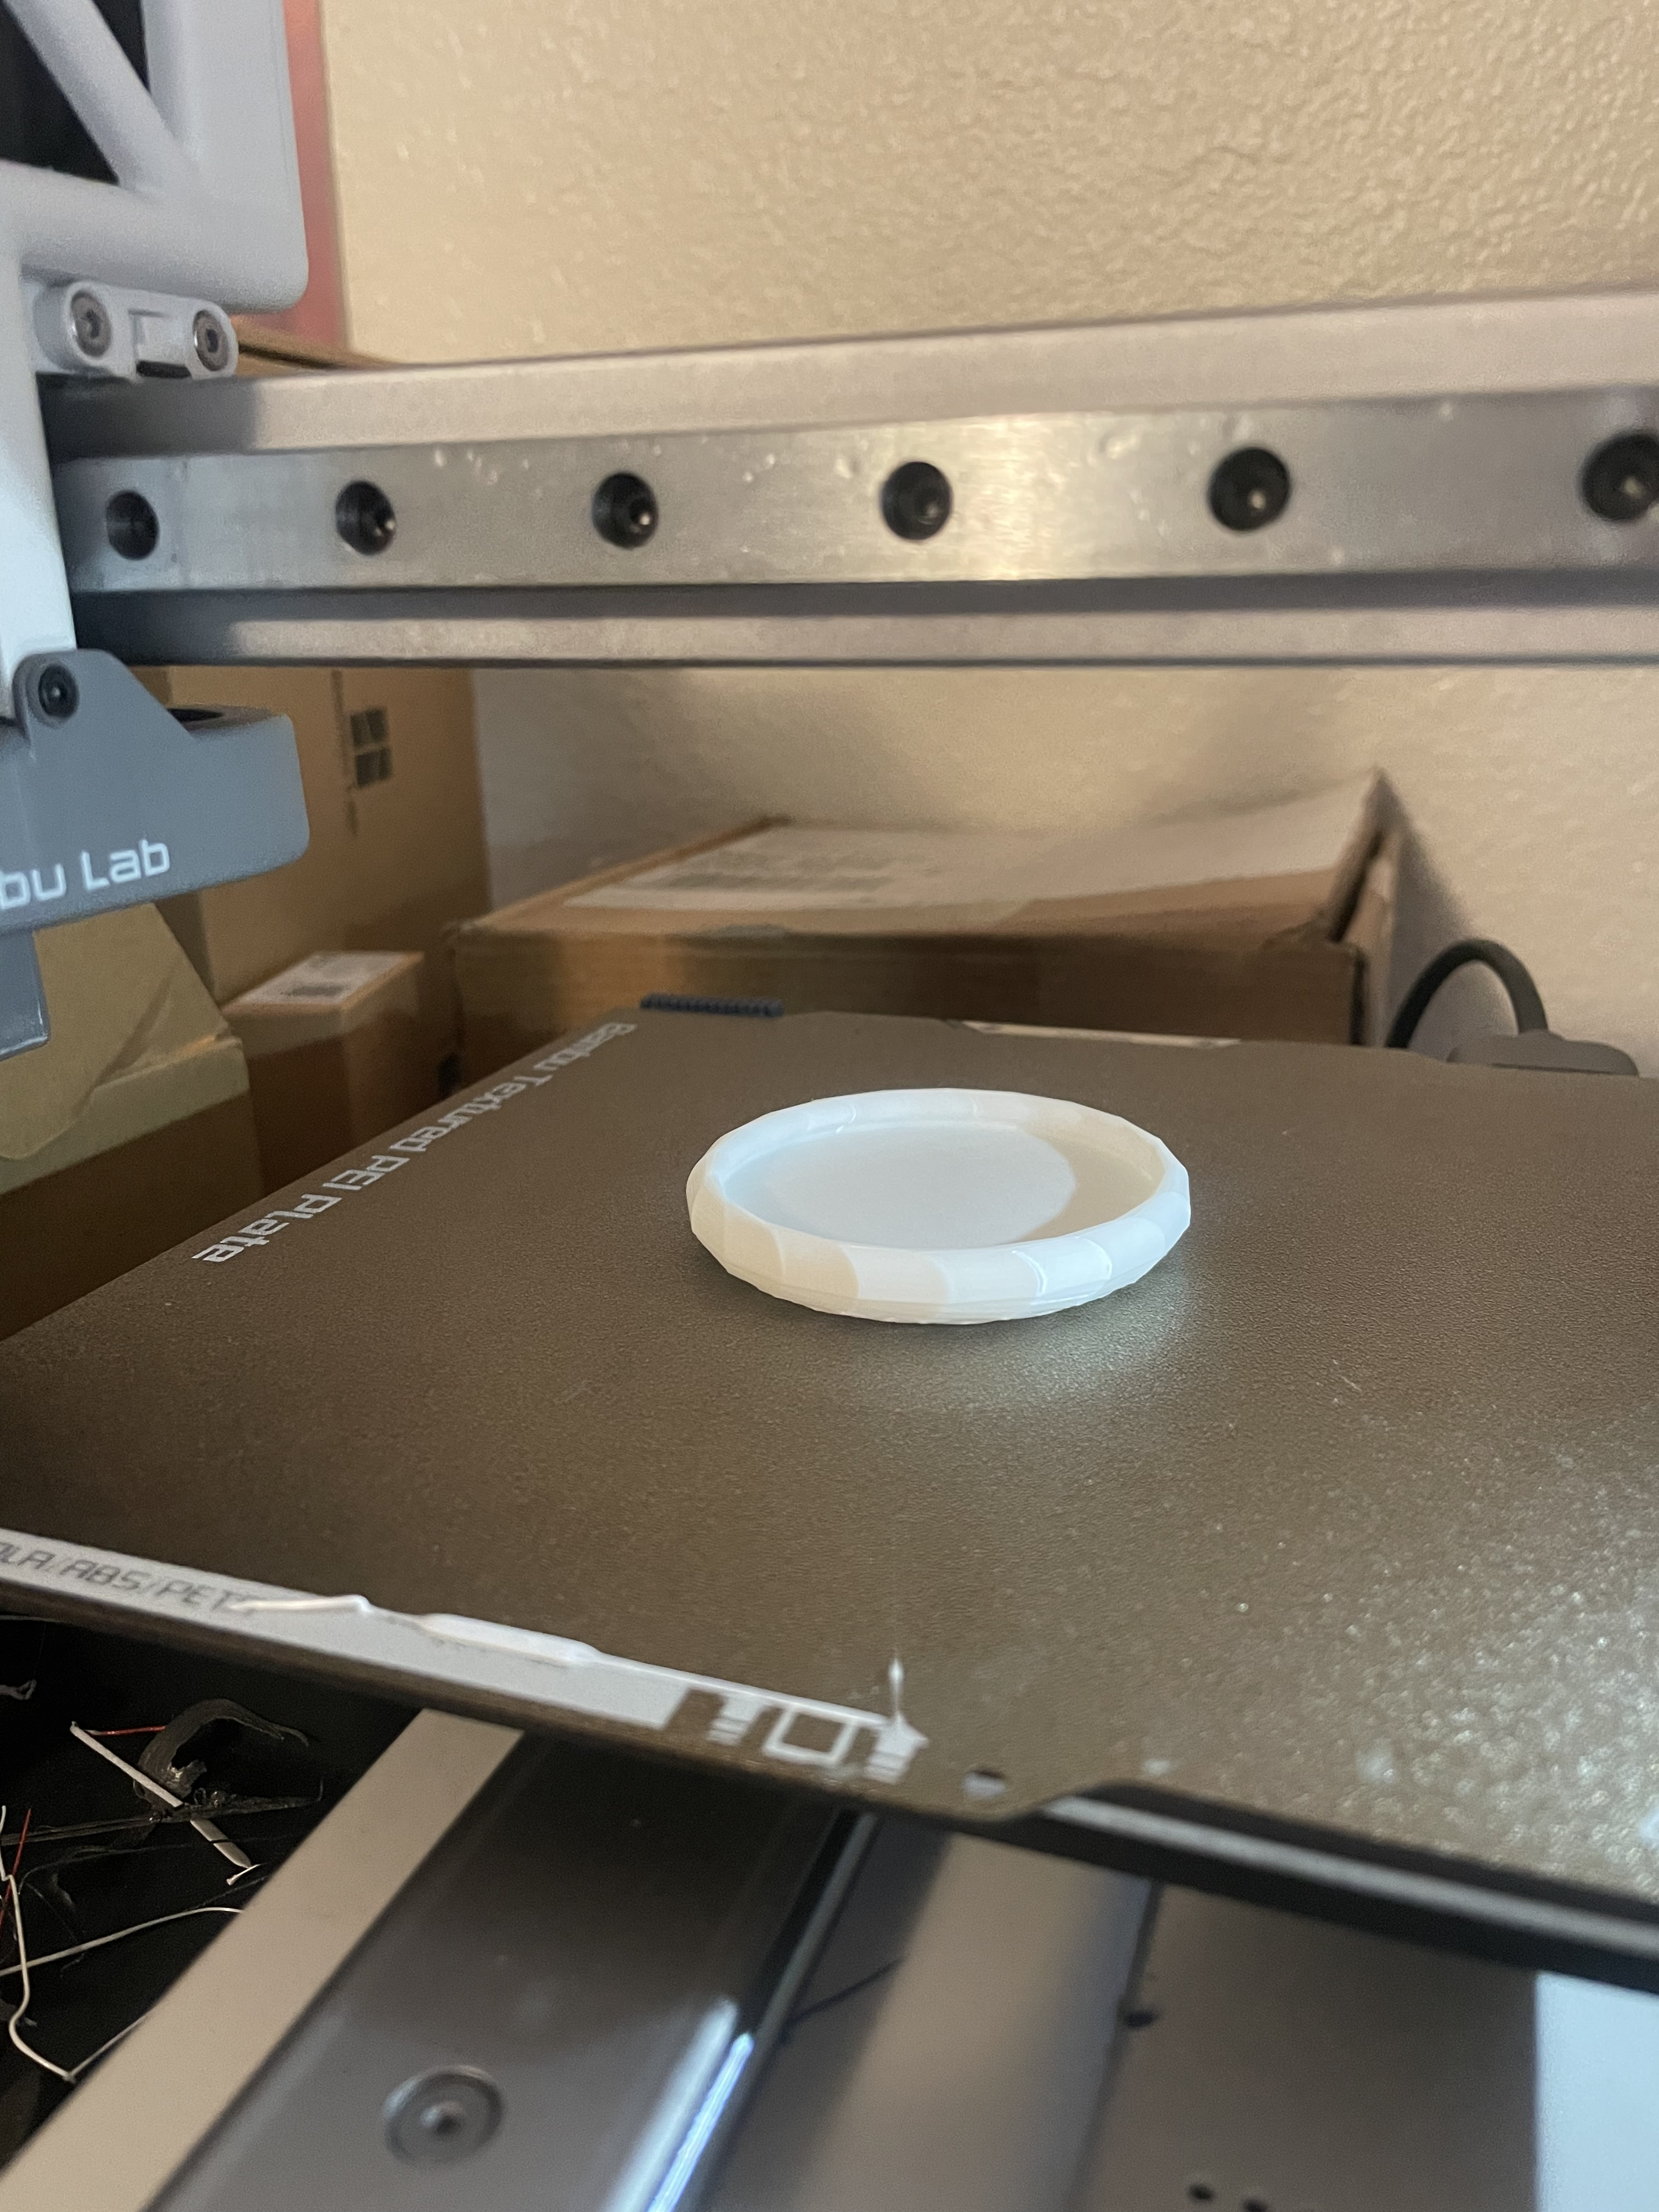
Below is a snippet of the code I used to generate the .STL file.
```# Number of rotations
num_rotations = 20

# Create a list to store rotated curves
rotated_curves = []

# Add homogeneous coordinate to each point
homogeneous_coordinates = np.column_stack((coordinates, np.ones(len(coordinates))))

# Rotation about x-axis
for i in range(num_rotations):
    angle = 2 * np.pi * i / num_rotations
    rotation_matrix = np.array([[1, 0, 0],
                                [0, np.cos(angle), -np.sin(angle)],
                                [0, np.sin(angle), np.cos(angle)]])
    rotated_coordinates = np.dot(homogeneous_coordinates, rotation_matrix.T)
    rotated_curves.append(rotated_coordinates)

# Create mesh
vertices = []
for curve in rotated_curves:
    vertices.extend(curve)
vertices = np.array(vertices)
faces = []
for i in range(num_rotations - 1):
    for j in range(len(coordinates) - 1):
        p1 = i * len(coordinates) + j
        p2 = i * len(coordinates) + j + 1
        p3 = (i + 1) * len(coordinates) + j
        p4 = (i + 1) * len(coordinates) + j + 1
        faces.append([p1, p2, p3])
        faces.append([p2, p4, p3])
for j in range(len(coordinates) - 1):
    p1 = (num_rotations - 1) * len(coordinates) + j
    p2 = (num_rotations - 1) * len(coordinates) + j + 1
    p3 = j
    p4 = j + 1
    faces.append([p1, p2, p3])
    faces.append([p2, p4, p3])

# Create mesh object
mesh_data = mesh.Mesh(np.zeros(len(faces), dtype=mesh.Mesh.dtype))
for i, f in enumerate(faces):
    for j in range(3):
        mesh_data.vectors[i][j] = vertices[f[j]]

# Write the mesh to file "output.stl"
mesh_data.save('output.stl')
Fun fact… I have my brain as a .STL file. It took 48 hours to print and is 1:1 scale.
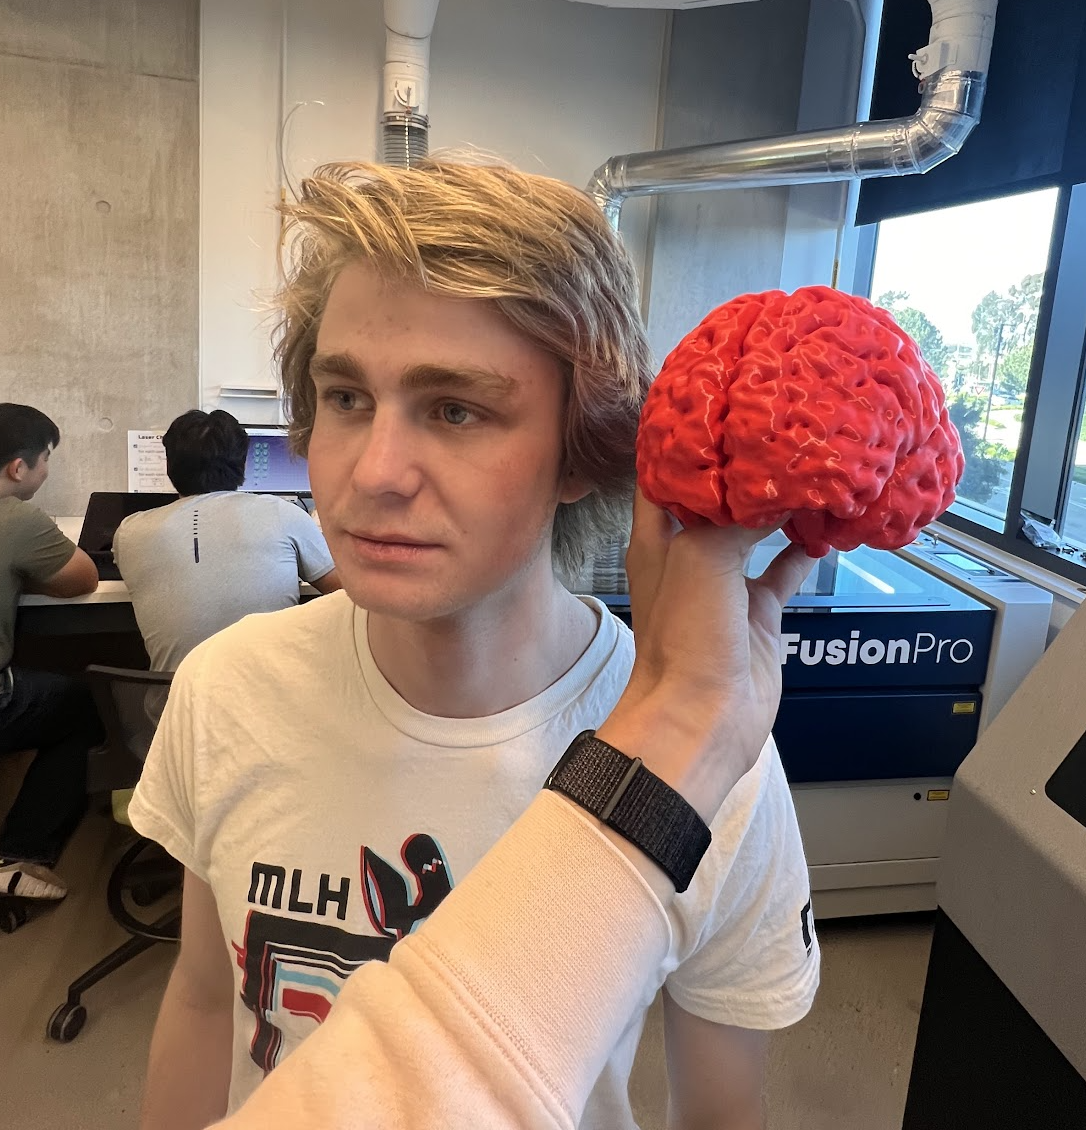
I swear I didn’t scale it up to make myself look smarter.
Here is a video of me talking about the assignment: